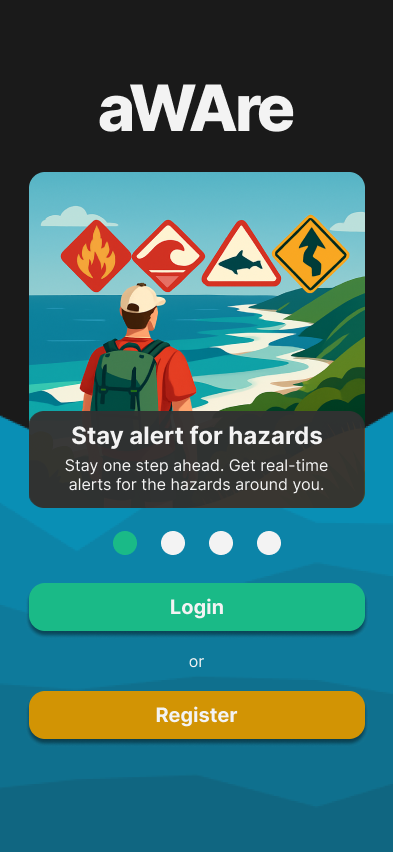
aWAre
A safety app developed in collaboration with marketing students at Edith Cowan University in Perth, providing users with hazard alerts and local community posts across Western Australia.
- International Collaboration
- Design Thinking
- User Research
- Prototyping
- Figma
- Mobile Development
- React Native
- Firebase
- Role
- Developer & Designer
- Timeline
- Spring 2025
- External Partner
- ECU
Problem
Our ECU partners came to us with a wicked problem: how might we effectively educate people about the dangers of wildlife and natural hazards in Western Australia?
Western Australia has apps for bushfires, apps for shark alerts, apps for weather. But there is no single app that brings it all together. And as an international tourist, you might not even know which dangers to look out for in the first place.
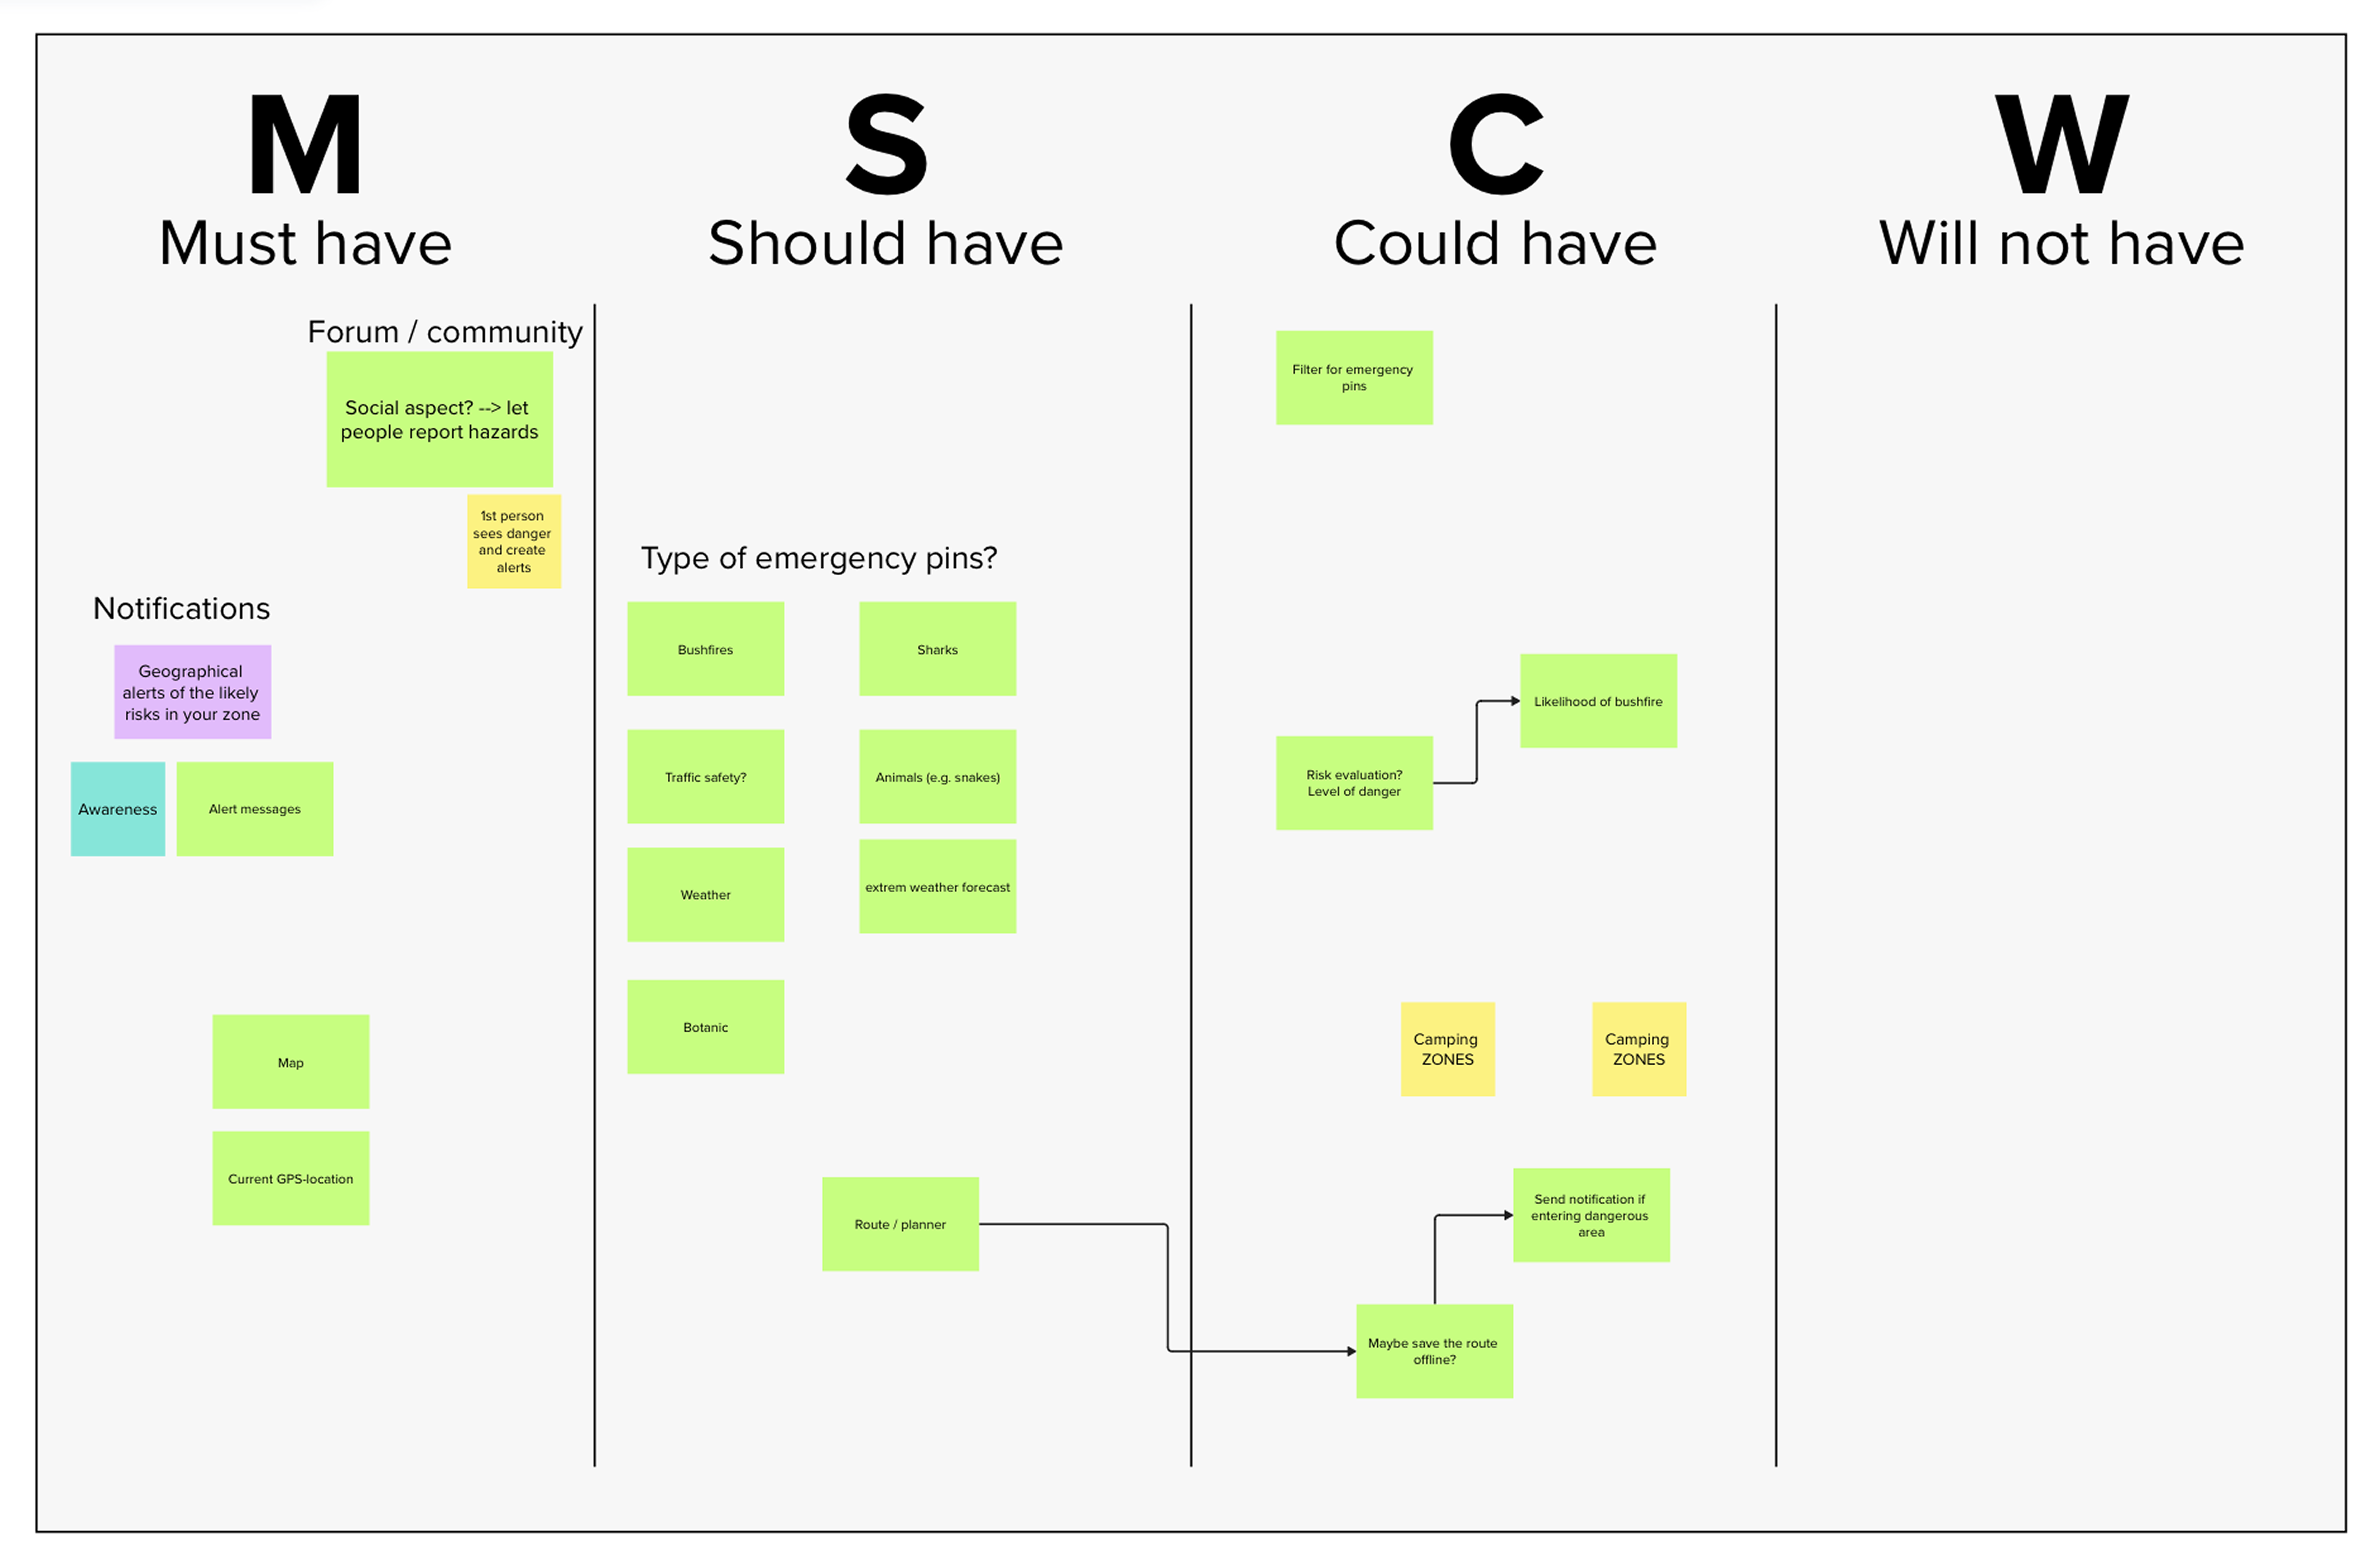
Concept Evolution
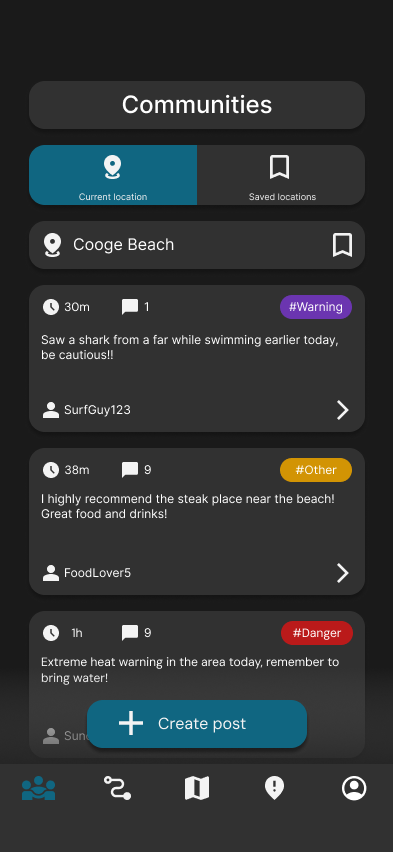
We started with two concepts. A map app showing hazards, and a quiz app for learning about dangers before arriving. The ECU students pushed back on both. The map was too similar to what already existed, and they believed that no one would open a quiz app while visiting. But both had something worth keeping, and the discussion that followed led to a new concept combining the map concept with a community feature.
We made one decision early that shaped everything after: the app would inform, not advise. Users are responsible for their own choices. aWAre helps the user to gain awareness about their surroundings, but what they do with that information is up to them.
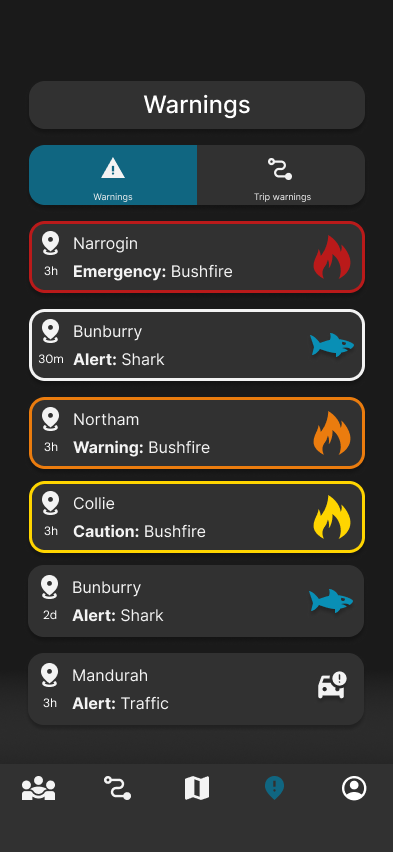
Design
The goal of the design was to keep it simple. The last thing you want when travelling in an unfamiliar country is an app that overwhelms you.
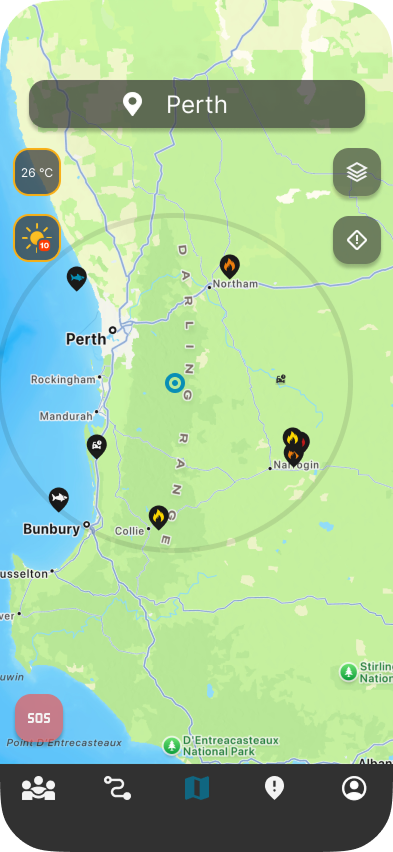
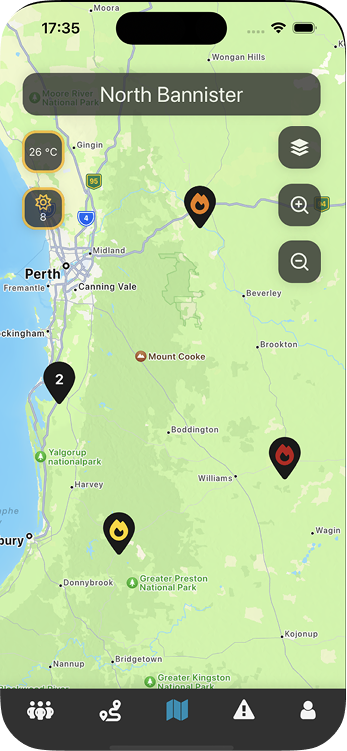
We worked in Figma through several iterations, presenting to the ECU students along the way and refining based on their feedback. The screenshots below are from the final Figma prototype.
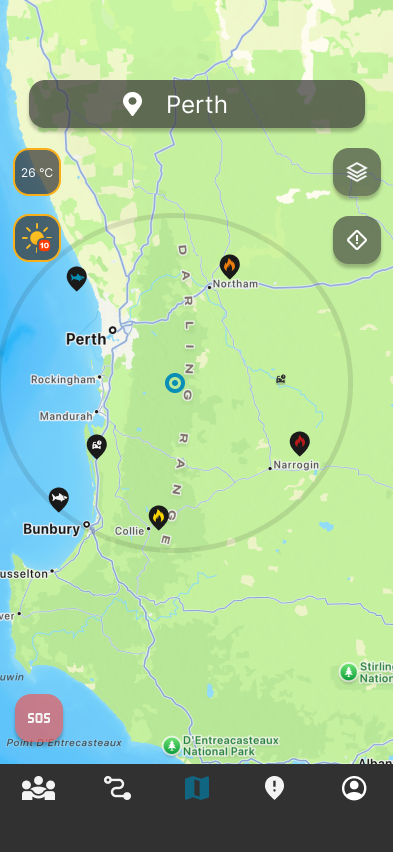
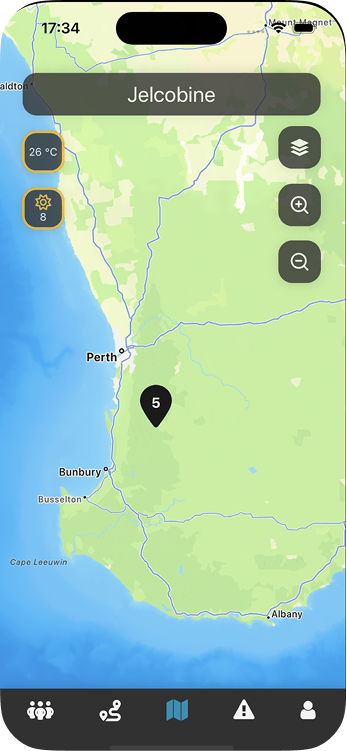
Pin Clustering
As the map filled with hazard pins, a problem emerged. When multiple pins appeared close together they overlapped and became hard to read. My individual assignment was to solve this.
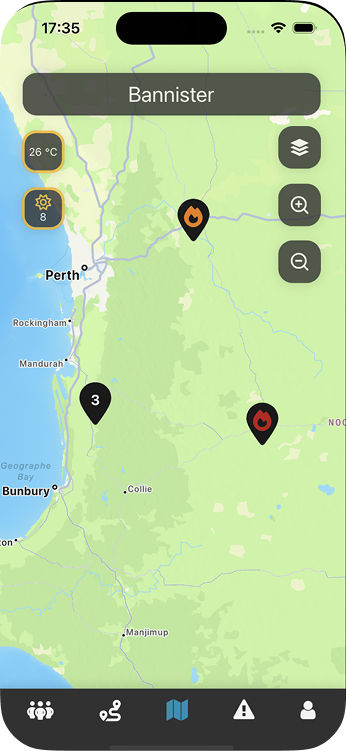
Instead of using a ready-made clustering library, I built a custom algorithm. Pins are grouped based on their latitude and longitude relative to the current zoom level, so clusters dissolve into individual pins as the user zooms in.
const groupPins = (pins: Pin[], region: Region) => {
  // Threshold proportional to zoom level
  const threshold = region.latitudeDelta * 0.2;

  const groups: { latitude: number; longitude: number; pins: Pin[] }[] = [];
  const visited = new Set<number>();

  for (let i = 0; i < pins.length; i++) {
    if (visited.has(i)) continue;

    const group = [pins[i]];
    const queue = [pins[i]];
    visited.add(i);

    // BFS — find all pins within threshold distance
    while (queue.length > 0) {
      const current = queue.pop()!;

      for (let j = i + 1; j < pins.length; j++) {
        if (visited.has(j)) continue;

        const target = pins[j];
        const latDiff = Math.abs(current.latitude - target.latitude);
        const lonDiff = Math.abs(current.longitude - target.longitude);

        if (latDiff < threshold && lonDiff < threshold) {
          group.push(target);
          queue.push(target);
          visited.add(j);
        }
      }
    }

    // Place group marker at average position of all pins
    const avg = group.reduce(
      (acc, pin) => ({
        latitude: acc.latitude + pin.latitude / group.length,
        longitude: acc.longitude + pin.longitude / group.length,
      }),
      { latitude: 0, longitude: 0 }
    );

    groups.push({ ...avg, pins: group });
  }

  return groups;
};The algorithm works well for a small set of pins, but it runs in O(n²) time. For every pin it checks every other pin. For a dataset with thousands of pins this would become noticeably slow, and is something I would revisit if the app were to scale. The grouping threshold is also a magic number tuned by trial and error rather than calculated from the actual viewport dimensions.